
 |  |  |
|---|---|---|
 |
Collaborators: Maria Luisa Escobar Pardo and Chung Truong
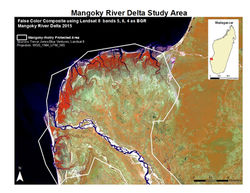
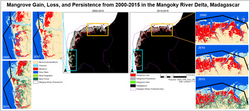
Abstract: The highly endemic and biodiverse mangrove ecosystems of the Mangoky River Delta provide essential ecosystem services including carbon storage and sequestration, and mitigation of sea level rise and effects of storm surge. Mangrove forest loss is rapidly increasing due to agricultural encroachment, extraction for firewood and charcoal production, and natural weathering processes. To complement previous assessments of the rates and extents of mangrove change between 1951-2000, land-cover maps were produced using Landsat-5, -7 and -8 imagery for the year 2000, 2010 and 2015. From 2000 to 2010, mangroves lost the most area to barren, cultivated, or burned land (16%), followed by river channels (2.79%). From 2010 to 2015, mangroves lost the most area to spiny forest (17.14%), followed by river channels (15.94%). Both time periods experienced changes along the eastern edge of the mangrove forest. Preliminary results suggest that the contributors of mangrove loss from 2010 to 2015 are terrestrial deforestation and incidents of increased precipitation in the form of tropical storms and cyclones. These events led to the degradation of mangrove habitat via an increase in sediment deposition and river bank erosion. Despite the inclusion of the Mangoky River Delta in the new Wetlands Complex Mangoky-Ihotry protected area in 2011, the rate of mangrove loss from 2010 to 2015 was greater than the rate of loss between 2000 and 2010.
Download the full report here.
Explaining the drivers of loss of mangrove cover in the Mangoky River Delta, Madagascar, 2000 - 2015
MY GIS PORTFOLIO
Collaborators: Isabel Miranda
Abstract: On October 4th, 2016 Category four Hurricane Matthew hit eastern Haiti, causing catastrophic damage. As of October 10th, the United Nations estimated that 1.4 million people in Haiti are in need of humanitarian assistance, with over 1,000 people dead. The cities of Les Cayes, Port Salut and Jérémie sustained the most damage. This project examined the five most populated cities affected by the hurricane. Network analysis was used to determine the percentage of households that are accessible to health services, defined as within a 1-hour walk or 5km. This analysis considered building damage from the Copernicus Emergency Management Services (EMS) for each city, alongside Humanitarian OpenStreetMap data for roadways and health facilities. Results indicated decreased accessibility in Jérémie (1%) and Les Cayes (20%), and an average accessibility of 52% for households in our five study areas after the hurricane.
Download the full report here.
Collaborators: John Rogan, Ph.D.
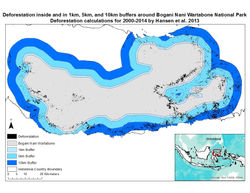
About this project: At the request of Wildlife Conservation Society, I investigated the total area of forest loss in, and in buffers around three National Parks in Indonesia as calculated by the UMD Global Forest Change product (Hansen et al 2013). In ArcGIS, I created buffers of 1km, 5km, and 10km distance around three National Parks of interest; Gunung Leuser National Park (GL), Sumatra, Bukit Barisan Selatan National Park (BBS), Sumatra, and Bogani Nani Wartabone National Park (BNW), Sulawesi. Zonal statistics calculated the amount of forest loss in each buffer, as well as inside each park. By percent area lost, BBS lost the largest area of forest cover at 4% loss (166.4km2), and BNW and GL both lost 2% lost, 74.7 km2 and 232.5km2, respectively. Investigation of the deforested areas in Google Earth revealed that the major driver of loss was agricultural encroachment, with some loss due to urban expansion. Overall, incidents of deforestation increased with distance from the park boundary (see graph of percent deforested).
Modeling accessibility of health facilities in Haiti after Hurricane Matthew 2016
 |  |  |
|---|---|---|
 |  |  |
 |
Assessing rates of deforestation inside, and in buffers around National Parks in Indonesia, 2000 - 2014
 |  |  |
|---|---|---|
 |

I mapped this potential distribution of the invasive Asian Longhorned Beetle in Worcester County, MA using environmental variables and Mahalanobis typicality as an assignment for my Landscape Ecology course.

Collaborators: Amy Leung We assessed the impacts of mining and land change from 1989 to 2009 in the habitat of the Chilean Flamingo. This map was created using Landsat imagery and displays soil salt content across the Salar de Atacama, Chile. For full report, please click on the link below.

At Clark University we are often asked to analyze the neighborhoods around us. I created this map to display the population density in Worcester, MA.